Blood Sugar Level Chart
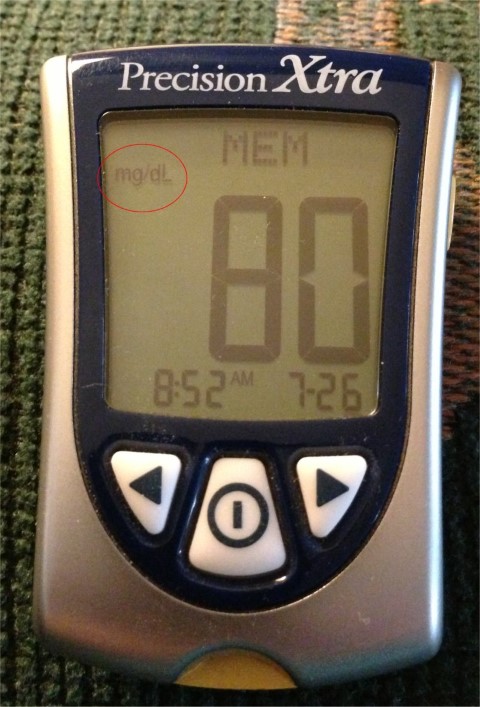
A blood sugar level chart can help you understand the levels of healthy blood sugar. Some of the tests listed below must be prescribed and administered by a doctor or medical clinic, but you can also use these charts along with a glucometer (a tool to test blood sugar at home) to decide which foods cause blood sugar spikes, and which to avoid to maintain low levels of blood sugar and hence, good health.
Fasting Blood Sugar Test

Fasting blood sugar is a measurement of your blood sugar after abstaining from food for 8-12 hours. This test is normally included with a CBC (complete blood chemistry) blood test. A CBC is a test often ordered by doctors when doing a comprehensive health evaluation. Fasting blood sugars are evaluated as follows:
| Fasting blood sugars after 8-12 hours without food: | |
| Normal blood sugar range: | between 60- 100 mg/dL |
| Pre -Diabetic range: | between 101- 126 mg /dL |
| Diabetic range: | more than 126 mg/dL on two different blood test occasions |
Fasting blood sugars are affected by many different body factors, so before an abnormal diagnosis is given, the doctor will want to see several results over a certain time range.
Oral Glucose Tolerance Test
An oral glucose tolerance test is used to test the body’s ability to metabolize a specific amount of glucose, clear it from the blood stream and return blood sugar levels to normal.
The patient is asked to eat normally for several days before the test. No food should be taken for 8-10 hours before the test, and there is no eating during the test. To begin the test, a fasting blood sugar is taken. Then the patient drinks a sweet liquid which contains approximately 75 grams of sugar in the form of glucose. The drink must be finished in 5 minutes. After sitting quietly for one to two hours, the patient’s blood sugar is re-tested and evaluated as follows on this blood sugar level chart:
Here's a blood sugar level chart for a 75-gram oral glucose tolerance test:
| Blood values for a 75-gram oral glucose tolerance test: | 2 hour measurement |
| Normal: | less than 140 mg/dL |
| Impaired glucose tolerance (Pre-diabetic range): | between 140-200 mg/dL |
| Diabetic range: | over 200 mg/dL |
Gestational Diabetes Screening
Gestational diabetes (GDM) is a condition in which blood sugar control gets worse during a woman's pregnancy. The test for GDM is generally given between the 24th and 28th week of pregnancy. The screening test most commonly used in the United States is an initial 50-gram 1-hour glucose challenge test (GCT). If the result on the GCT is abnormal (greater than 140 mg/dL after one hour), the patient will be given a 100-gram 3-hour oral glucose tolerance test (OGTT). Two or more abnormal values on the OGTT are considered a diagnosis of GDM.
Blood values for a 100-gram oral glucose tolerance test:
| Blood values for a 100-gram gestational oral glucose tolerance test: | Measurements indicative of diabetic range: |
| Fasting | 95 mg/dL or higher |
| One hour measurement: | 180 mg/dL or higher |
| Two hour measurement: | 155 mg/dL or higher |
| Three hour measurement: | 140 mg/dL or higher |
Personal Blood Testing: Keep Your Own Blood Sugar Level Chart
Blood sugar testing is a great tool to determine your potential for high blood sugar and diabetes. If you are diabetic, personal blood testing can help you control your blood sugar and insulin intake more accurately.
You can measure your blood glucose levels with an inexpensive glucometer and test strips at home. To gain an accurate picture of your blood sugar control, four or more tests a day can be taken. You should record the food you eat at each meal and then the blood sugar readings afterwards. This information gathered and written on a homemade chart can then be used to adjust food intake and exercise to greatly improve blood sugar levels. Diabetics can use this method to adjust insulin levels as well. Testing can improve your blood sugar results, and help you maintain healthy blood sugar ranges. Using this method, you can quickly determine what foods spike your blood sugar and make it harder to control.
Use this blood sugar level chart to evaluate your personal blood sugar readings:
| Blood Glucose Level Normal Targets: | |
|---|---|
| Before each meal: | 80-120 mg/dl |
| 2 hours after meals: | less than 180 mg/dl |
| At bedtime | 100-140 mg/dl |
Glycosylated Hemoglobin or Hemoglobin A1c (HbA1c)
The HbA1c test reflects average blood sugar levels over the previous two to three months.
The formula use to calculate the average blood glucose level from the HbA1C test is as follows:
- HbA1C level x 33.3 – 86 = average blood glucose level for the past 90 days. HbA1C can be helpful to track diabetic control over time.
- Example: If your HbA1c level is 5.9, the formula would be (5.9 x 33.3)-86 and would tell you that your average blood sugar was 110 over the past 90 days or so.
| HbA1c Test Results: | |
|---|---|
| Normal range: | less than 6.0 |
| Pre-diabetic range: | between than 6.5 and 7 |
| Diabetic range: | greater than 7 |
Read the HbA1c page for more information on this marker and how it affects heart disease and diabetes risks.
All of my books are available in electronic PDF, and now in paperback on Amazon!
 |
 |
 |
|
Buy paperbook on Buy paperback on Amazon Buy the e-Book via Paypal |
Buy paperback on Buy paperback on Amazon Buy the e-Book via Paypal |
Buy paperback on Buy paperback on Amazon Buy the e-Book via PayPal |